ARDC
Ares Dynamic Credit Allocation Fund, Inc. (NYSE:ARDC) is a closed-ended fixed income fund/ “CEF” managed by Ares Management LLC. which primarily invests in U.S. securities and companies’ senior loans whose debt is rated below investment grade, corporate bonds primarily with high yield issues rated below investment grade, equity securities and debt securities issued by CLOs, and some other fixed-income instruments. It looks at the overall macroeconomic environment, financial markets, and company specific research to create its portfolio. It has a market value of $352 million.
Ares Dynamic Credit Allocation Fund, Inc. was formed on November 27, 2012, with its headquarters in Los Angeles, CA.
CEFs, such as ARDC, are generally measured by two simple parameters:
1 – Discount to NAV.
2 – Yield which is determined by price and distribution.
1- Net Asset Value / NAV
When it comes to CEFs (as well as to many other investments), there’s one simple, sure-fire method for success: buy cheap. “Cheap” refers to buying it at a discount to NAV. The higher the discount – the better. Currently, the NAV according to the analyst Morningstar “M*” is $14.71.
Price now is $15.40 which means it is selling over the NAV by ~4.5%, so not at a discount. Depending on most CEF’s the greater the discount the better. Some quality CEFs may sell at a premium, but this one and most others are generally not to be purchased over NAV.
2- Yield
Price determines yield along with the distribution, which is reviewed next.
Price Movement
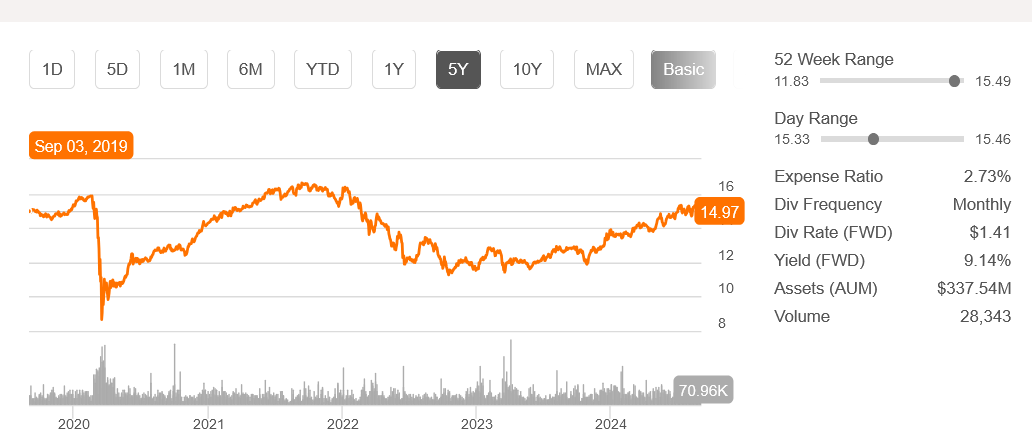
The chart below from Seeking Alpha shows 5 years, and it can be seen it is reaching another high price level. The last high was late in 2021 going into 2022 and now again in 2024.
ARDC 5-year technical chart for price movement. (Seeking Alpha September 4, 2024)
In 2020, the price hit a low, which also had a price cut in the distribution, as shown in the next discussion of the distribution.
ARDC Distribution History
Distribution
ARDC pays monthly, announcing it usually mid-month for payment on the 30th. It just went ex-dividend on August 20th and paid 11.75c on August 30th.
Below is the distribution rate change for ARDC since early 2020 when interest rates were low and holding steady and before the more recent high inflation. These funds are holding senior secured loans “SSL” that benefit from higher rates and while rates went up – so did the distribution which rises all through 2022 and 2023 as seen in the chart below.
|
ARDC |
$ Distribution |
Action |
|
March 2020 |
0.1075 |
|
|
April 2020 |
0.0975 |
Cut |
|
August 2022 |
0.1025 |
Raise |
|
January 2023 |
0.1075 |
Raise |
|
April 2023 |
0.1125 |
Raise |
|
October 2023 |
0.1175 |
Raise |
Yield
The yearly distribution is now $1.41 giving it a yield of ~9.2% at a price of $15.40.
However, back in 2020 it was selling for $10 or so and had a distribution of $1.17 with a yield of 11.7% or more and certainly quite a bit higher than today.
Since CEFs are diversified, it becomes almost impossible to offer a constant price appreciation potential that single common stocks do, and they are also unreliable for distributions.
Therefore, I see ARDC as having a low yield in comparison to the quite higher yields seen at a lower price. Time to consider the next rate change and what it could or would do to the price, distribution and yield.
The Federal Reserve “The Fed”
The Fed has hinted several times that it may end up cutting rates this September. If so, that will be bad news for SSL funds, which means their future gains will be even lower than they are now and consequently, the monthly distributions may decrease as well.
Common advice heard often and told to investors is: “Don’t fight the Fed” and the future for ARDC most likely will be lower profits and lower distributions which leads as well to a lower price.
The pattern for owning this CEF.
-
Buy cheap.
-
Wait for the discount to NAV to close.
-
Repeat.
It seems simple but relies on watching The Fed and interest rates.
Rose Take and Recommendation
The Fed cutting rates, and I believe it will happen in September, makes this one difficult to sell, but the handwriting is on the wall to do so. Follow the pattern and buy back when there is another discount to NAV.
Summary/ Conclusion
Rose’s Income Garden portfolio “RIG” has 84 stocks and a 6.4% forward yield with value up 13.95% YTD and beating SPY by 9.4% since inception November 2021.
Macro Trading Factory is a macro-driven service, run by a team of experienced investment managers.
The service offers two portfolios: “Funds Macro Portfolio” & “Rose’s Income Garden”; both aim to outperform the SPY on a risk-adjusted basis, in a relaxed manner.
Suitable for those who either have little time/knowledge/desire to manage a portfolio on their own, and/or wish to get exposed to the market in a simple, though more risk-oriented (less volatile), way.
Each of our portfolios, spanning across all sectors, offers you a hassle-free, easy to understand and execute, solution.
Read the full article here


