Performance Assessment
My last article on B Riley (NASDAQ:RILY) and its whole gamut of securities expressed a very contrarian ‘Strong Sell’ view to the Seeking Alpha community. I liked reading, engaging and also learning from others in the lively comments section.
From a performance perspective, it looks like the market has adjudged my assessments to be accurate as the stock has fallen 64.35% since:
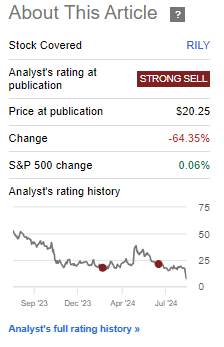
Performance since Author’s Last Update on B Riley (Seeking Alpha, Author’s Last Article on B Riley)
I am pleased to report that in addition to getting my assessment in B Riley common stock correct, I was also accurate in outlining the hierarchy of relative performance expectations among all RILY related securities. As I had noted in my last article:
Like last time, my thesis is focused on B. Riley’s balance sheet and operating performance at the EBIT level, which occurs before the claims of equity investors, preferred equity investors and debt security investors. Hence, my view is applicable to all the different listed instruments under the RILY umbrella (RILY) (NASDAQ:RILYP), (NASDAQ:RILYL), (NASDAQ:RILYM), (NASDAQ:RILYG), (NASDAQ:RILYK), (NASDAQ:RILYN), (NASDAQ:RILYZ) and (NASDAQ:RILYT).
My pecking order is to prefer the securities maturing sooner with a lower yield. Therefore, RILYM, which matures in 2025, is my most preferred pick if I was forced to choose; I believe this has the lowest chances of capital erosion. The common equity shareholder class is my least preferred; I expect the worst returns here.
– Author’s comments in last B Riley article
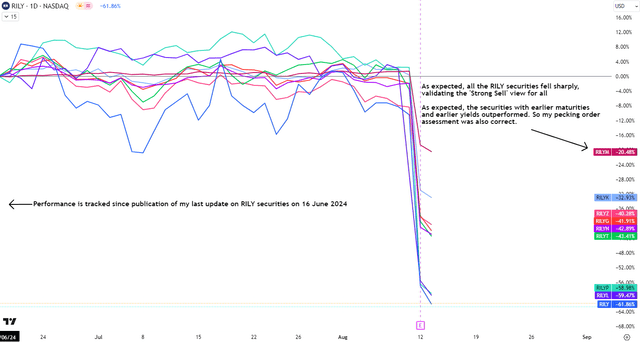
Performance of all B Riley Securities since Author’s Last Update (TradingView, Author’s Analysis)
As can be seen in the performance comparisons above, all RILY securities sharply, validating the ‘Strong Sell’ view for all. Moreover, the hierarchy preference was also accurate as RILYM (the preferred share class with the earliest maturity and lowest yield) outperformed the other longer duration securities.
Once again, I want to make clear that my thesis and views are applicable to not only RILY common stock, but all the other preferred shares as well since my view is primarily based upon the balance sheet and operating performance at the EBIT level, which occurs before the claims of equity investors, preferred equity investors and debt security investors.
Thesis Update
Most of the total decline of 64% since my last update occurred in the last couple of days as the stock fell 57% at the start of this week after reporting poor preliminary Q2 FY24 results, which involved a sharp net loss in earnings due mostly to large asset writedowns (discussed later below):
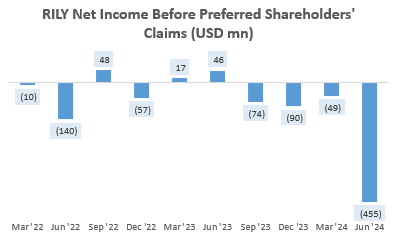
RILY Net Income Before Preferred Shareholders’ Claims (Company Filings, Author’s Analysis)
As I discuss later, the company’s liquidity position has significantly deteriorated, which has forced management to suspend its dividends. The extent of the asset writedowns has only to added to the company and its management’s woes; in addition to already receiving subpoenas related to the company’s dealings with Brian Kahn (former CEO of one of B Riley’s investment holdings – Franchise Group), the SEC is also looking into the adequacy of the company’s risk disclosures.
After reviewing a preliminary release of Q2 FY24 results (the full results have not yet been disclosed), I maintain my bearish stance on the stock as I note the following:
- The balance sheet health has gotten far worse
- RILY trades at a 1x P/B but its net asset value may be deep in the red
The balance sheet health has gotten far worse
As the company has not yet released all its financials yet, I have filled in whatever data is available and utilized a ceteris paribus (all else being equal) assumption in envisioning what B Riley’s balance sheet looks like after Q2 FY24:

B Riley Assets Analysis (Company Filings, Author’s Analysis)
The green highlighted cells in the table above indicate numbers that B Riley has reported. The yellow-highlighted numbers indicate line items to which I have allocated the asset write-downs. The remaining numbers for the quarter ended June 2024 are assumed to have no sequential change.
B Riley reported a $350 million (mid-point) non-cash markdown in some investments:

B Riley Q2 FY24 Preliminary Results Report (Company Filings, Author’s Highlights)
I am assuming that these are not short term investments. I have made a judgement call and allocated these markdowns to the goodwill line item for now. In addition, I have included a $28 million of goodwill impairment in Targus; there is no ambiguity in allocation here as management too referred to this as a goodwill impairment.
Overall, this has resulted in a 80.2% markdown in goodwill. Now, in my previous articles on B Riley, I have consistently argued for excluding goodwill in assessment of balance sheet value. For example in my last note on the stock, I said:
In a forced sale of asset situation, I believe goodwill is not a reliable source of value, particularly since the company has started to have impairments of its goodwill in recent quarters.
– Author’s stated view on goodwill treatment in value assessment
And in my preliminary note on the stock, I said:
I have excluded goodwill as it is a balancing figure to reflect the premiums paid on acquisitions. In an asset sale scenario, I posit that goodwill is an unreliable source of value, particularly when the core business has negative earnings.
– Author’s stated view on goodwill treatment in value assessment
This treatment of goodwill in B Riley’s value appraisal has been a point of contention in the comments discussion of my articles before. However, I believe the $378 million markdown in asset value seen in Q2 FY24 provides more credence to my approach to goodwill in this case.
Also noteworthily, B Riley incurred a $25 million charge related to valuation allowance for deferred income taxes (i.e. due to falling asset values, they expect lower deferred income tax benefits). I have allocated this to the “Other Long Term Assets” line item. Doing this results in a 50% sequential drop in asset value for this line item, assuming all else is equal.
Another alarming fact is that liquidity has dropped precipitously to $1.1 billion as of Q2 FY24:
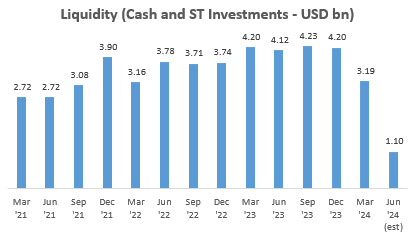
Liquidity (Cash and ST Investments) in USD bn (Company Filings, Author’s Analysis)
Overall, the combination of the fall in cash and short term investments liquidity and asset writedowns has eroded almost 50% of the company’s asset value, all else being equal. Hence, it is clear that the balance sheet health has gotten worse.
RILY trades at a 1x P/B but its net asset value may be deep in the red
Today, RILY trades at book value:
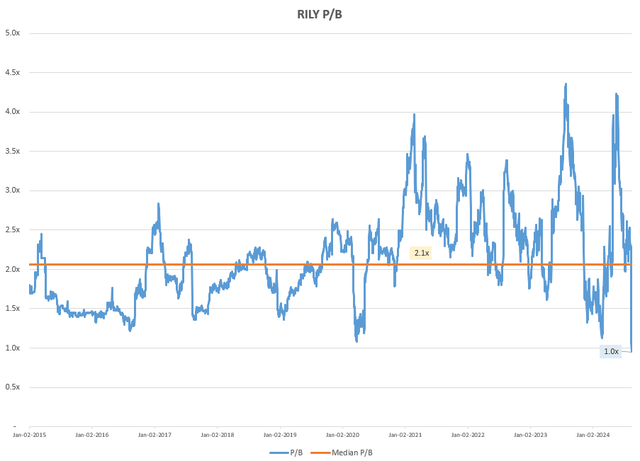
RILY P/B (Capital IQ, Author’s Analysis)
However, after plugging in the known total debt values of $2,160 million and assuming all else is equal vs last quarter for the liabilities side of the balance sheet too, I estimate net asset values to be deep in the red; regardless of whether goodwill is counted in the calculation:
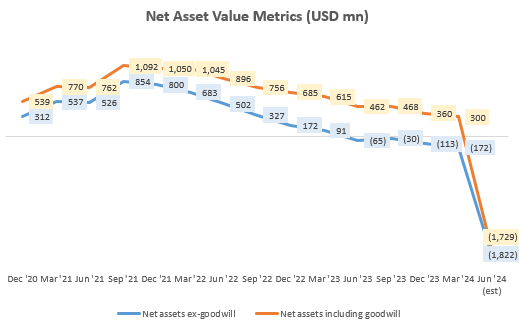
Net Asset Value Metrics (USD mn) (Company Filings, Author’s Analysis)
This indicates to me potential for a continued mispricing (overvaluation) in the stock. Note however that the book value used in this calculation may still be based on Q1 FY24’s figures. I am awaiting the release of the company’s pending fully updated financials will make the valuation assessment clearer.
Key monitorables going forward
Excluding the $403 million in asset writedowns, B Riley’s normalized net income before the claims of preferred shareholders is still a loss of $52 million. This combination of normalized loss-making operations, a dwindling liquidity position and a likely negative net asset value position in the balance sheet does not bode well for the company. It is under these circumstances that firms get closer to bankruptcy.
When the company releases its full-year results, I would be especially interested in updating my calculations of core operating earnings. This is a an earnings metric I use that excludes the impact of volatile mark-to-market P&L earnings. I have discussed the computation and rationale for this at length in my initiating coverage of B Riley.
I am also keeping track of the short interest in the stock, which has risen over the past month and a bit from the high 20% levels to almost 41% now:
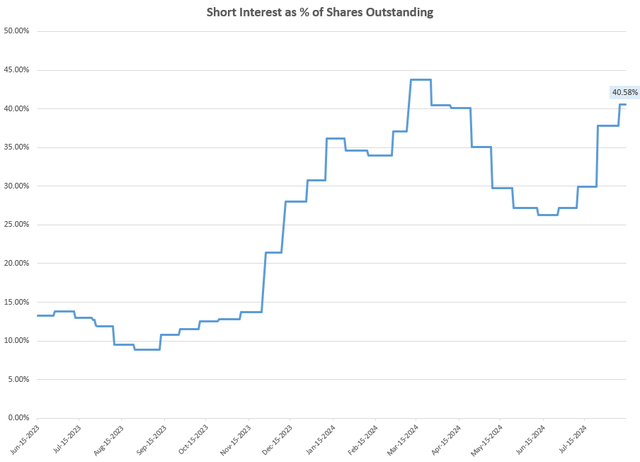
Short Interest as % of Shares Outstanding (Capital IQ, Author’s Analysis)
The stock borrow fees for short positions are also very high currently at 152% annualized. Due to this, I believe short positions in the stock are risky as they may be susceptible to a temporary short squeeze.
Takeaway & Positioning
My earlier, ‘Strong Sell’ stance on B Riley common stock and all its other security classes has worked out quite well as the stock has seen a massive 64% fall since my last update. The other security classes also have seen large erosions of value of at least 20%. Altogether, B Riley’s securities have also all moved in tandem with my relative performance expectations, with the most defensive performance coming from the 6.375% Senior Notes due 2025 (RILYM).
The preliminary Q2 FY24 results release has exposed large asset write-downs which I believe has eradicated a significant chunk (80% according to my estimate) of goodwill, thus giving credence to prior treatment of goodwill wherein I excluded it due to my belief that it was not a reliable source of value. Overall, this has significantly worsened the company’s net asset value position and the quality of its balance sheet. Yet, the common stock today still trades at close to 1.0x P/B, which I believe may indicate mispricing. However, the release of fully updated financials will make this clearer.
According to my calculations, B Riley’s normalized earnings before the claims of preferred shareholders is still negative. I believe this, combined with the weak balance sheet position and reduced cash and short term investment liquidity increases the chance of cash bleed and asset value erosion. Upon release of complete Q2 FY24 financials, I will be monitoring my measure of core operating earnings to better assess the company’s interest coverage and debt coverage ratios.
From a market sentiment perspective, the short interest in the stock now stands at an elevated 41%. The annual stock borrow fees for short positions is also very high at 152%. I believe this increases the risks of a short squeeze as it indicates a bit of crowdedness in the shorts. Hence, I am not adopting any active short position in B Riley nor any of its other security classes.
All in all, I maintain a bearish stance with a ‘Sell’ rating on B Riley common stock and all of its other security classes as well.
How to interpret Hunting Alpha’s ratings:
Strong Buy: Expect the company to outperform the S&P500 on a total shareholder return basis, with higher than usual confidence. I also have a net long position in the security in my personal portfolio.
Buy: Expect the company to outperform the S&P500 on a total shareholder return basis
Neutral/hold: Expect the company to perform in-line with the S&P500 on a total shareholder return basis
Sell: Expect the company to underperform the S&P500 on a total shareholder return basis
Strong Sell: Expect the company to underperform the S&P500 on a total shareholder return basis, with higher than usual confidence
The typical time-horizon for my views is multiple quarters to around a year. It is not set in stone. However, I will share updates on my changes in stance in a pinned comment to this article and may also publish a new article discussing the reasons for the change in view.
Read the full article here


