Auto sales hit by CDK hack. Gasoline and auto sales in dollars hit by dropping prices, but they boost inflation-adjusted consumer spending.
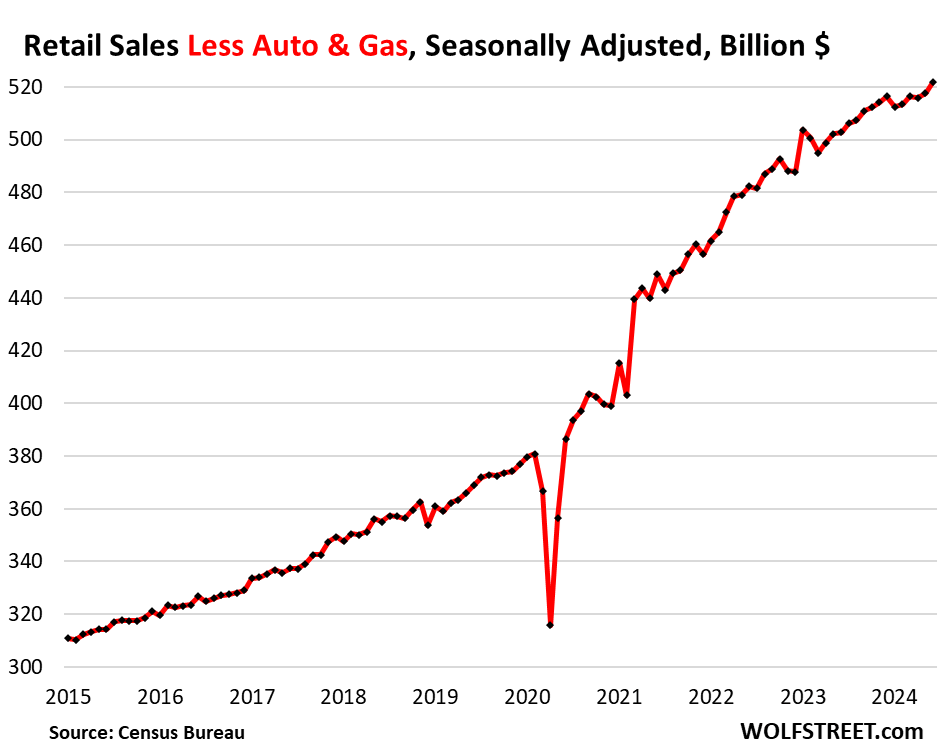
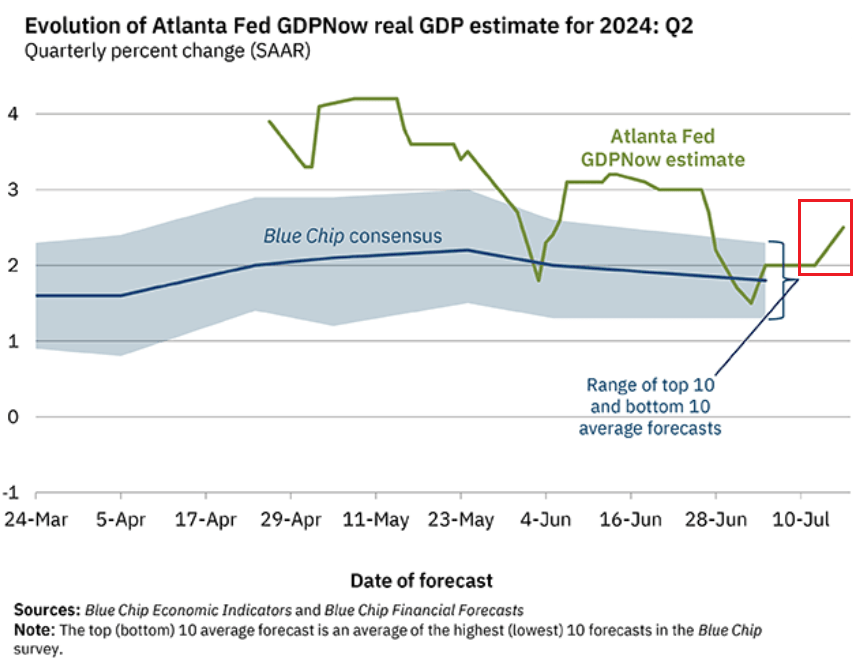
Retail sales without gasoline and auto sales jumped by 0.8% in June from May, seasonally adjusted, the biggest increase since January 2023, spread among many categories of retailers, including a massive increase in ecommerce sales. Year-over-year, they rose 3.8%. This month-to-month jump caused the Atlanta Fed to raise its GDPNow forecast for Q2 GDP growth to 2.5% today, from 2.0% last week.
The Atlanta Fed’s GDPNow forecast for Q2 real GDP was updated today with the data from June retail sales, which caused its real GDP forecast to jump to 2.5% today, from 2.0% last week. For the US, 2.5% real GDP growth is well above the longer-run average of just under 2%. GDPNow’s measure for real consumer spending growth rose to 2.1% from 1.6%.
The CDK hack and lower prices
Sales at dealers of new and used motor vehicles and at parts stores are the largest category in retail sales, accounting for 19% of total retail sales. Sales of 15,000 of these auto dealers got hit when the ransomware attack on CDK’s cloud-based dealer management system took down their computers on June 19 for the rest of the month, which reduced their ability to process sales of vehicles and parts in June, which caused the biggest auto dealers to warn about its impact on Q2 revenues and earnings, and dented vehicle unit-sales in June. Those sales that didn’t get processed in June will get processed in July.
In addition, dollar-sales at auto dealers (19% of total retail) and gas stations (7.7% of total retail) experienced large price drops in June, with used vehicle prices in a historic downward spiral that has now unwound 60% of the crazy price spike in 2021 and 2022. Retail sales are not adjusted for price changes. The lower prices lowered the dollar-sales, not the unit sales. But the lower prices (deflation) of motor vehicles and gasoline boost consumer spending in “real” terms, adjusted for deflation in those items, opposite of what happened back when inflation in those items was hot and reduced “real” consumer spending on those items.
Total retail sales
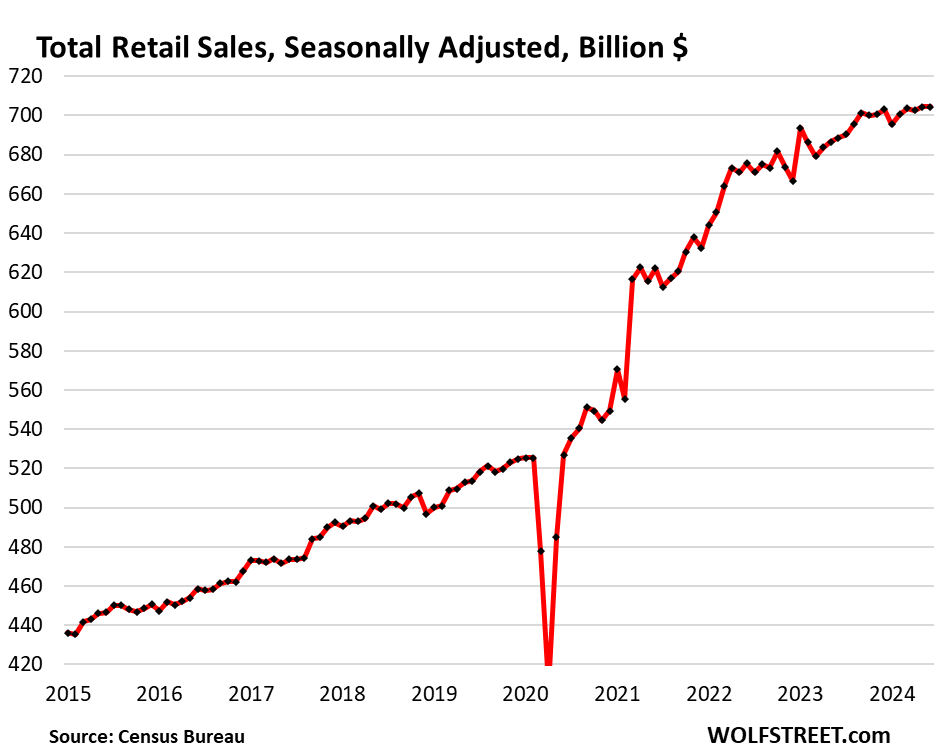
Total Retail sales were unchanged in June from May, at $704 billion, seasonally adjusted, and were up 2.3% year-over-year, despite the ransomware hack and the widespread price declines in goods, that included motor vehicles, electronics, furniture, and many other goods.
Sales at the largest categories of retailers
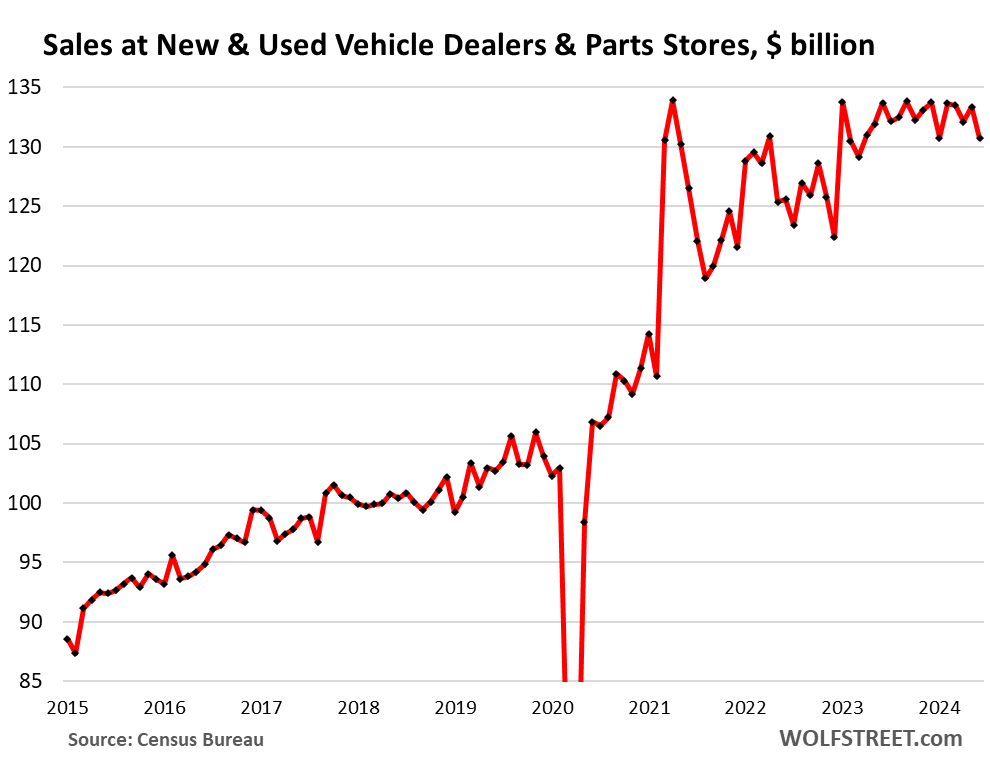
New and used vehicle dealers and parts stores (19% of total retail). Note the 2% month-to-month drop in June, mostly due to 15,000 dealers not being able to process sales after the CDK hack.
The relatively flat sales for the past 18 months are due to dropping prices. The number of vehicles sold, so unit sales have been up year-over-year all year long, both in new and used vehicles:
- Sales: $131 billion
- From prior month: -2.0%
- Year-over-year: -2.2%
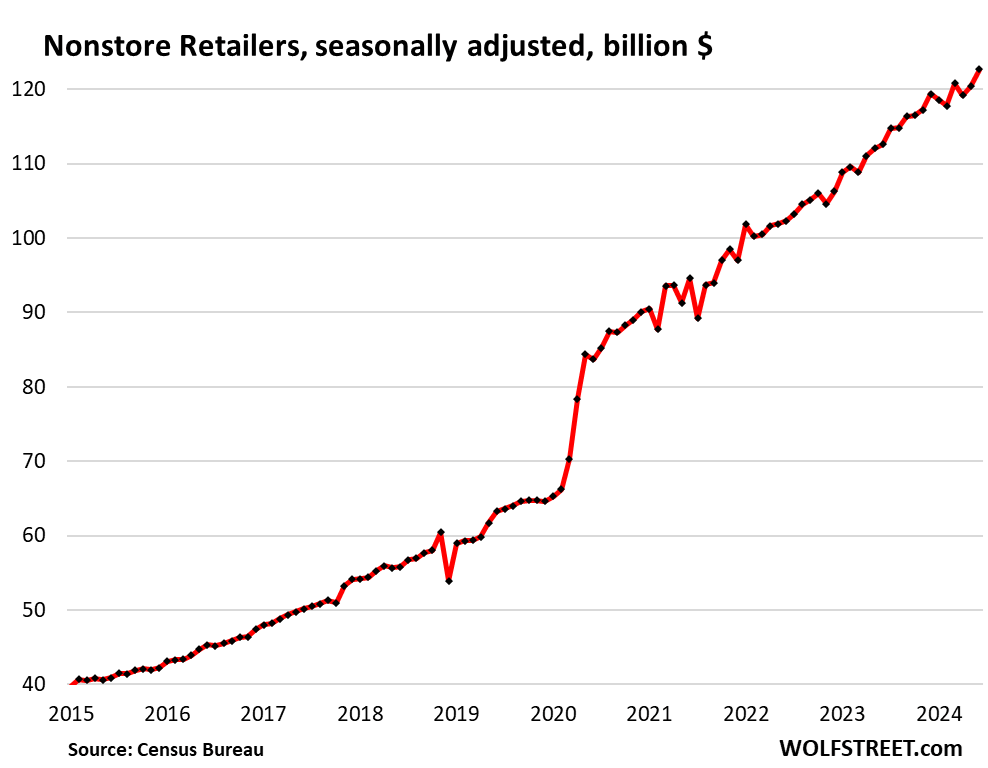
Ecommerce and other “nonstore retailers” (17% of total retail trade), includes ecommerce retailers, ecommerce operations of brick-and-mortar retailers, and stalls and markets:
- Sales: $123 billion
- From prior month: +1.9%
- Year-over-year: +8.9%
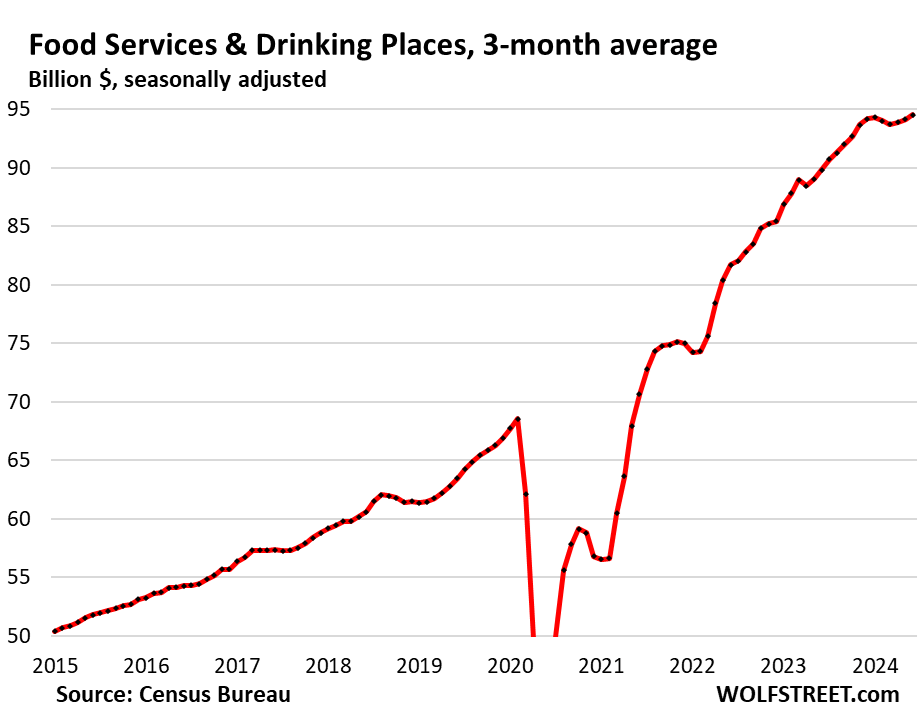
Food services and drinking places (restaurants, cafes, bars, etc., 13% of total retail). The chart shows the three-month moving average (3mma). You can see the slowdown earlier this year, and the re-acceleration over the past three months:
- Sales: $95 billion
- From prior month: +0.3%
- Year-over-year: +4.4%
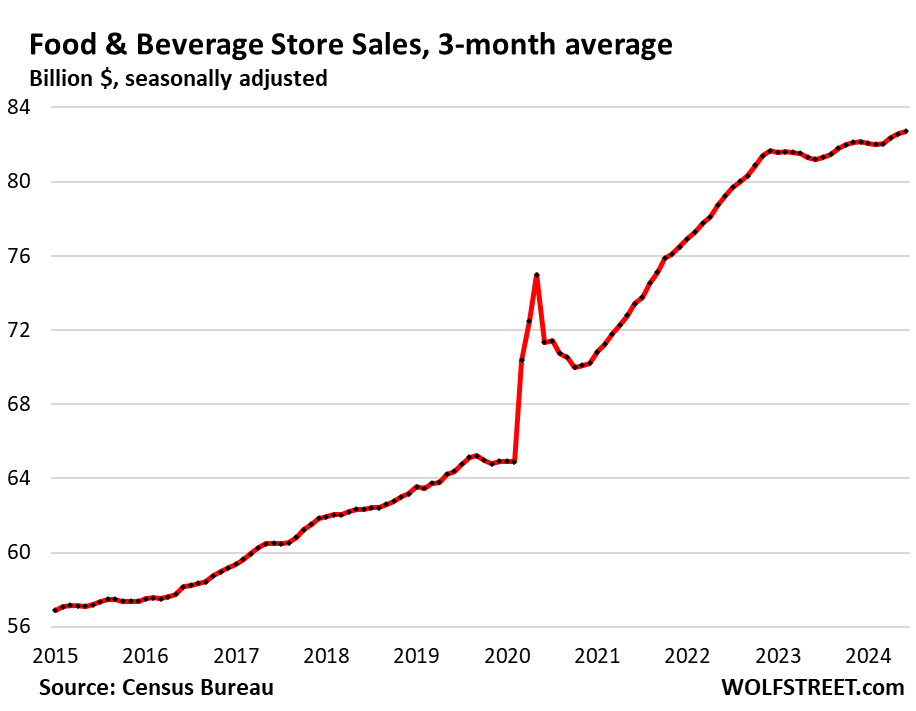
Food and Beverage Stores (12% of total retail):
- Sales: $83 billion
- From prior month: +0.1%
- Year-over-year: +1.9%
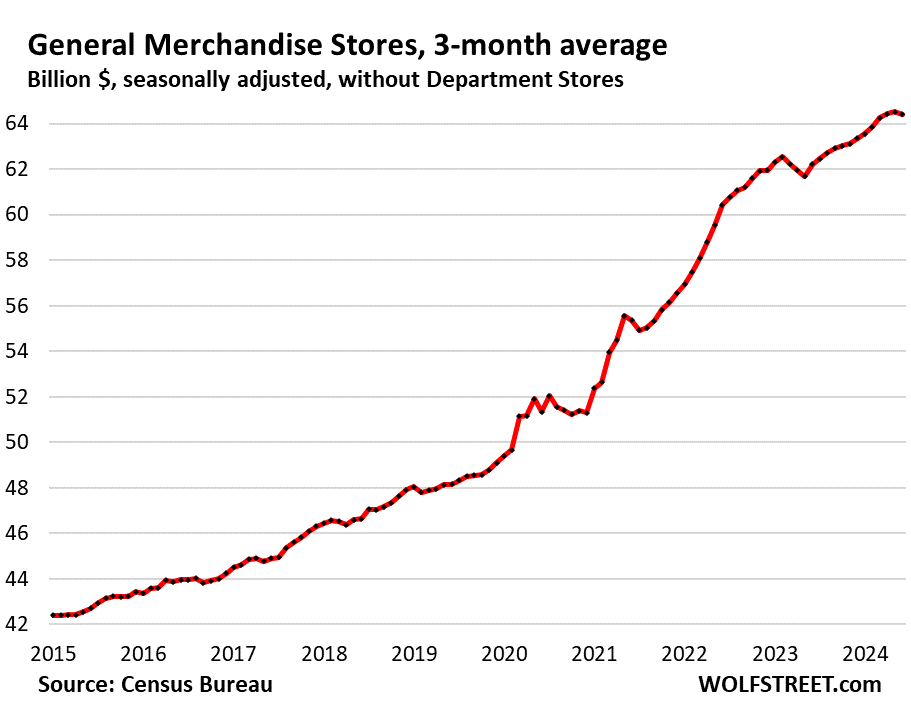
General merchandise stores, without department stores (9% of total retail).
- Sales: $65 billion
- From prior month: +0.5%
- From prior month, 3mma: -0.2%
- Year-over-year: +3.5%
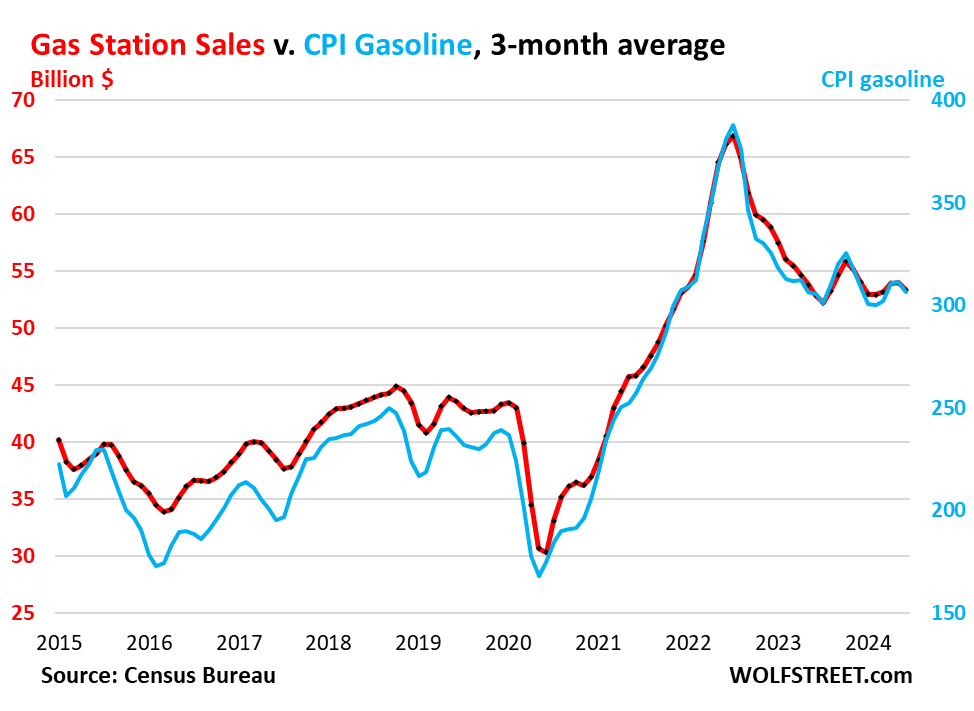
Gas stations (8% of total retail sales). Sales at gas stations move in near-lockstep with the price of gasoline, and the price of gasoline dropped over the past months, and so sales in dollars dropped:
- Sales: $52 billion
- From prior month: -3.0%
- From prior month, 3mma: -1.2%
- Year-over-year: -0.4%
Sales in billions of dollars at gas stations, including other merchandise that gas stations sell (red, left axis), and the CPI for gasoline (blue, right axis):
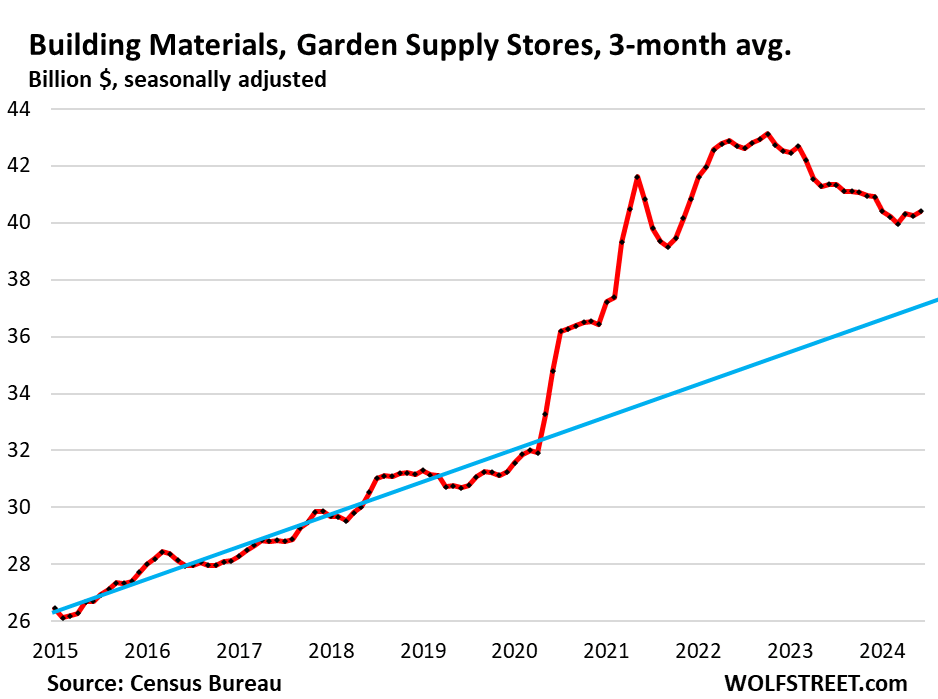
Building materials, garden supply and equipment stores (6% of total retail). The pre-pandemic trendline in blue:
- Sales: $41 billion
- From prior month: +1.4%
- From prior month, 3mma: +0.4%
- Year-over-year, 3mma: 5.7%
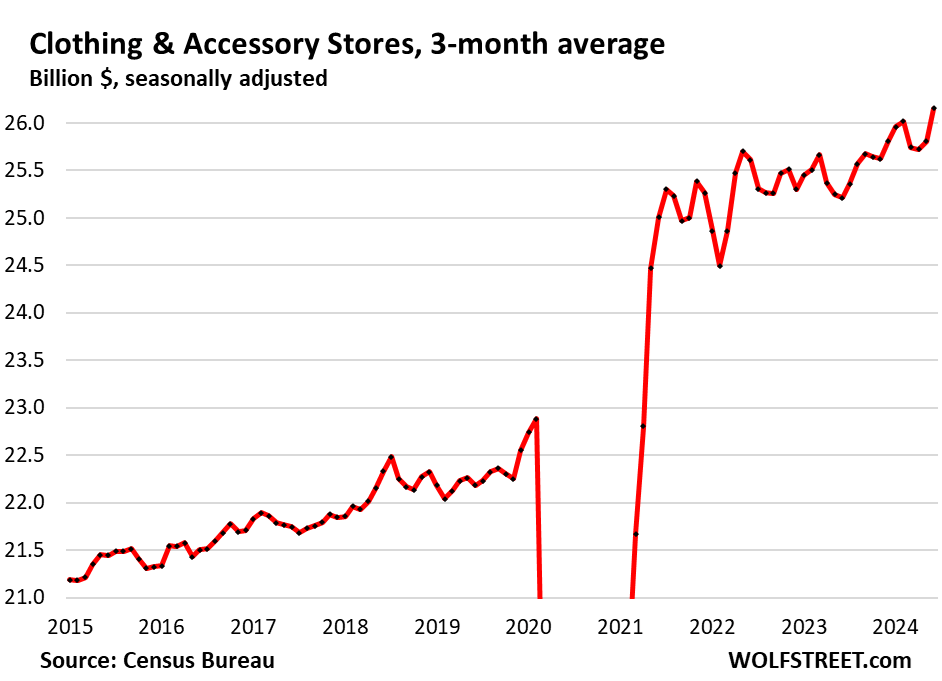
Clothing and accessory stores (3.7% of retail):
- Sales: $26 billion
- From prior month: +0.6%
- From prior month, 3mma: +1.3%
- Year-over-year: +4.3%
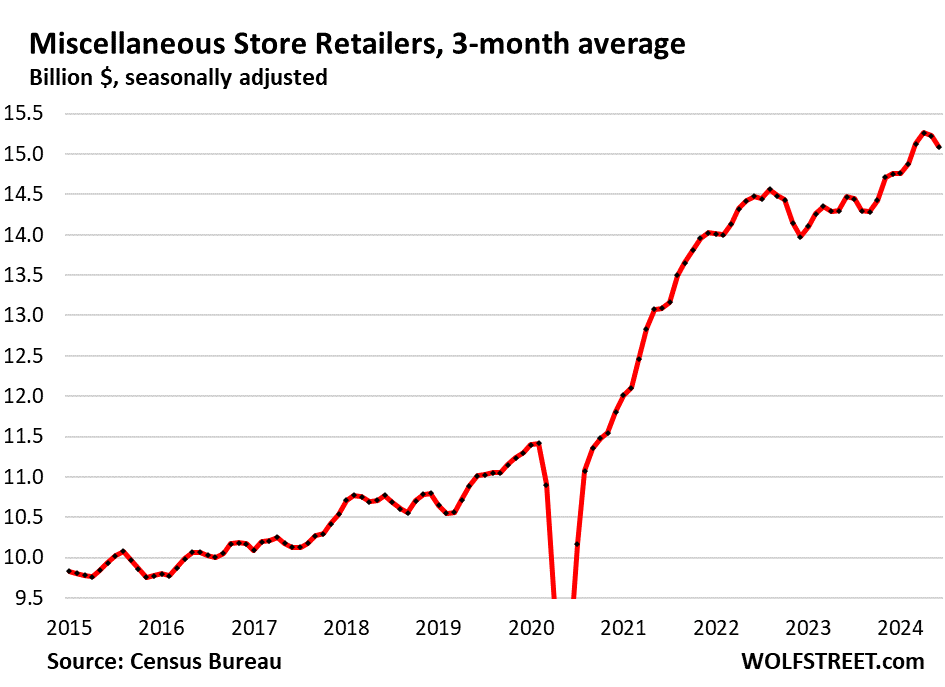
Miscellaneous store retailers (2.2% of total retail): Specialty stores, including cannabis stores.
- Sales: $15 billion
- Month over month: +0.3%
- Month over month 3mma: -0.9%
- Year-over-year, 3mma: +4.3%
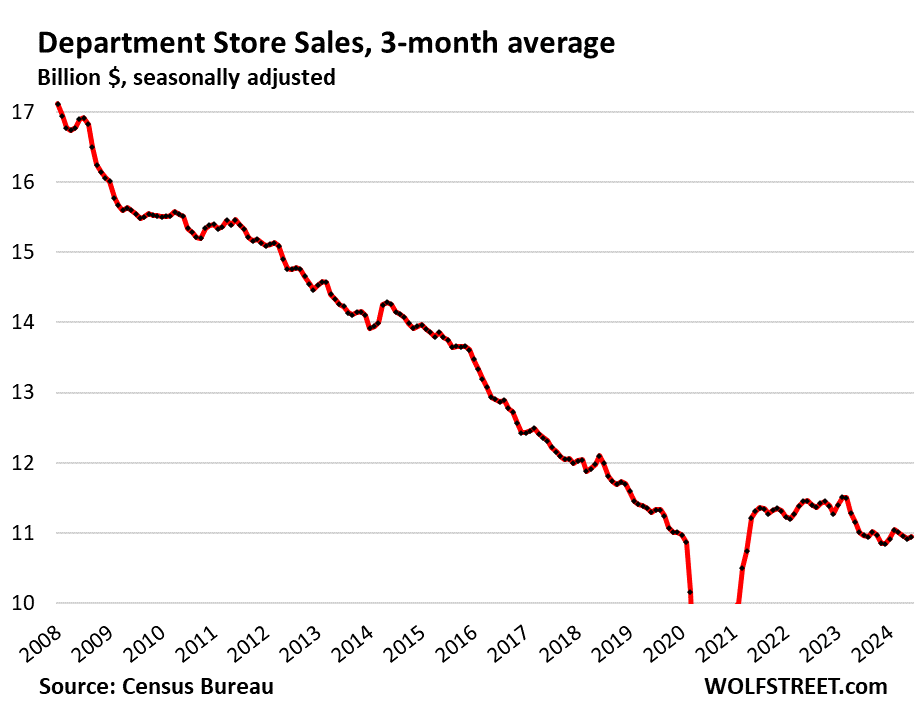
Department stores (now down to just 1.5% of total retail sales, from around 10% in the 1990s). Ecommerce sales by department store chains are not included here, but are included in ecommerce retail sales above. This chart is the epitome of what we started to document in 2016 in our column, Brick and Mortar Meltdown:
- Sales: $11 billion
- From prior month: +0.4%
- From prior month, 3mma: +0.3%
- Year-over-year, 3mma: -0.6%
- From peak in 2001: -43%.
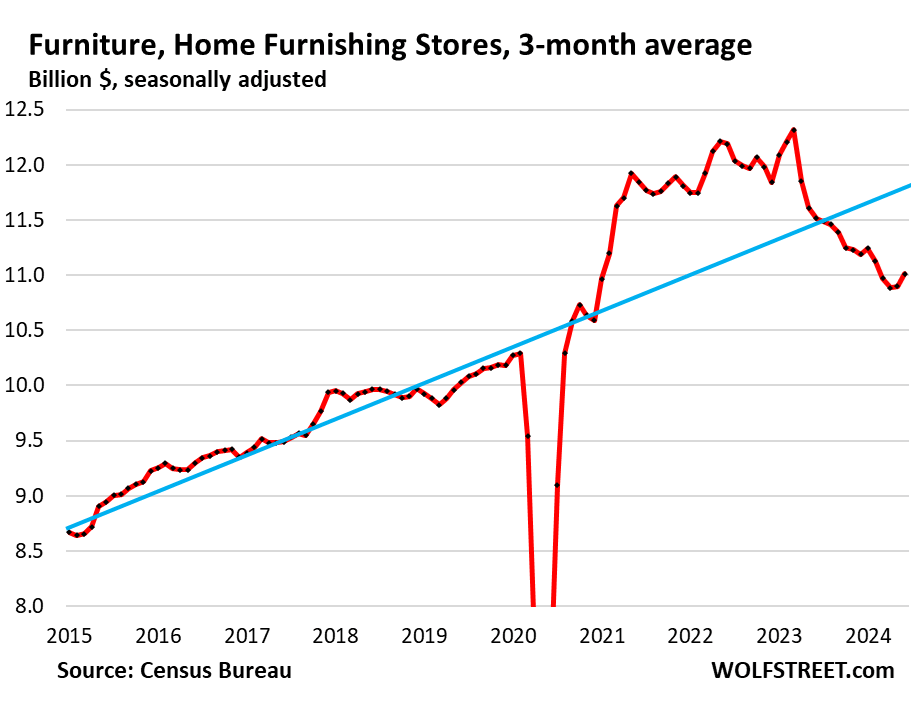
Furniture and home furnishing stores (1.6% of total retail). Much of furniture and furnishing sales have moved to ecommerce. This is what’s left over at brick-and-mortar retailers that specialize in furniture and furnishings.
- Sales: $11 billion
- From prior month: +0.6%
- From prior month, 3mma: +1.0%
- Year-over-year, 3mma: -4.4%.
Original Post
Editor’s Note: The summary bullets for this article were chosen by Seeking Alpha editors.
Read the full article here


